Systems development is systematic process which includes phases such as planning, analysis, design, deployment, and maintenance. Here, in this tutorial, we will primarily focus on −
- Systems analysis
- Systems design
Systems Analysis
It is a process of collecting and interpreting facts, identifying the problems, and decomposition of a system into its components.
System analysis is conducted for the purpose of studying a system or its parts in order to identify its objectives. It is a problem solving technique that improves the system and ensures that all the components of the system work efficiently to accomplish their purpose.
Analysis specifies what the system should do.
Systems Design
It is a process of planning a new business system or replacing an existing system by defining its components or modules to satisfy the specific requirements. Before planning, you need to understand the old system thoroughly and determine how computers can best be used in order to operate efficiently.
System Design focuses on how to accomplish the objective of the system.
System Analysis and Design (SAD) mainly focuses on −
- Systems
- Processes
- Technology
What is a System?
The word System is derived from Greek word Systema, which means an organized relationship between any set of components to achieve some common cause or objective.
A system is “an orderly grouping of interdependent components linked together according to a plan to achieve a specific goal.”
Constraints of a System
A system must have three basic constraints −
- A system must have some structure and behavior which is designed to achieve a predefined objective.
- Interconnectivity and interdependence must exist among the system components.
- The objectives of the organization have a higher priority than the objectives of its subsystems.
For example, traffic management system, payroll system, automatic library system, human resources information system.
Properties of a System
A system has the following properties −
Organization
Organization implies structure and order. It is the arrangement of components that helps to achieve predetermined objectives.
Interaction
It is defined by the manner in which the components operate with each other.
For example, in an organization, purchasing department must interact with production department and payroll with personnel department.
Interdependence
Interdependence means how the components of a system depend on one another. For proper functioning, the components are coordinated and linked together according to a specified plan. The output of one subsystem is the required by other subsystem as input.
Integration
Integration is concerned with how a system components are connected together. It means that the parts of the system work together within the system even if each part performs a unique function.
Central Objective
The objective of system must be central. It may be real or stated. It is not uncommon for an organization to state an objective and operate to achieve another.
The users must know the main objective of a computer application early in the analysis for a successful design and conversion.
Elements of a System
The following diagram shows the elements of a system −

Outputs and Inputs
- The main aim of a system is to produce an output which is useful for its user.
- Inputs are the information that enters into the system for processing.
- Output is the outcome of processing.
Processor(s)
- The processor is the element of a system that involves the actual transformation of input into output.
- It is the operational component of a system. Processors may modify the input either totally or partially, depending on the output specification.
- As the output specifications change, so does the processing. In some cases, input is also modified to enable the processor for handling the transformation.
Control
- The control element guides the system.
- It is the decision–making subsystem that controls the pattern of activities governing input, processing, and output.
- The behavior of a computer System is controlled by the Operating System and software. In order to keep system in balance, what and how much input is needed is determined by Output Specifications.
Feedback
- Feedback provides the control in a dynamic system.
- Positive feedback is routine in nature that encourages the performance of the system.
- Negative feedback is informational in nature that provides the controller with information for action.
Environment
- The environment is the “supersystem” within which an organization operates.
- It is the source of external elements that strike on the system.
- It determines how a system must function. For example, vendors and competitors of organization’s environment, may provide constraints that affect the actual performance of the business.
Boundaries and Interface
- A system should be defined by its boundaries. Boundaries are the limits that identify its components, processes, and interrelationship when it interfaces with another system.
- Each system has boundaries that determine its sphere of influence and control.
- The knowledge of the boundaries of a given system is crucial in determining the nature of its interface with other systems for successful design.
Types of Systems
The systems can be divided into the following types −
Physical or Abstract Systems
- Physical systems are tangible entities. We can touch and feel them.
- Physical System may be static or dynamic in nature. For example, desks and chairs are the physical parts of computer center which are static. A programmed computer is a dynamic system in which programs, data, and applications can change according to the user's needs.
- Abstract systems are non-physical entities or conceptual that may be formulas, representation or model of a real system.
Open or Closed Systems
- An open system must interact with its environment. It receives inputs from and delivers outputs to the outside of the system. For example, an information system which must adapt to the changing environmental conditions.
- A closed system does not interact with its environment. It is isolated from environmental influences. A completely closed system is rare in reality.
Adaptive and Non Adaptive System
- Adaptive System responds to the change in the environment in a way to improve their performance and to survive. For example, human beings, animals.
- Non Adaptive System is the system which does not respond to the environment. For example, machines.
Permanent or Temporary System
- Permanent System persists for long time. For example, business policies.
- Temporary System is made for specified time and after that they are demolished. For example, A DJ system is set up for a program and it is dissembled after the program.
Natural and Manufactured System
- Natural systems are created by the nature. For example, Solar system, seasonal system.
- Manufactured System is the man-made system. For example, Rockets, dams, trains.
Deterministic or Probabilistic System
- Deterministic system operates in a predictable manner and the interaction between system components is known with certainty. For example, two molecules of hydrogen and one molecule of oxygen makes water.
- Probabilistic System shows uncertain behavior. The exact output is not known. For example, Weather forecasting, mail delivery.
Social, Human-Machine, Machine System
- Social System is made up of people. For example, social clubs, societies.
- In Human-Machine System, both human and machines are involved to perform a particular task. For example, Computer programming.
- Machine System is where human interference is neglected. All the tasks are performed by the machine. For example, an autonomous robot.
Man–Made Information Systems
- It is an interconnected set of information resources to manage data for particular organization, under Direct Management Control (DMC).
- This system includes hardware, software, communication, data, and application for producing information according to the need of an organization.
Man-made information systems are divided into three types −
- Formal Information System − It is based on the flow of information in the form of memos, instructions, etc., from top level to lower levels of management.
- Informal Information System − This is employee based system which solves the day to day work related problems.
- Computer Based System − This system is directly dependent on the computer for managing business applications. For example, automatic library system, railway reservation system, banking system, etc.
Systems Models
Schematic Models
- A schematic model is a 2-D chart that shows system elements and their linkages.
- Different arrows are used to show information flow, material flow, and information feedback.
Flow System Models
- A flow system model shows the orderly flow of the material, energy, and information that hold the system together.
- Program Evaluation and Review Technique (PERT), for example, is used to abstract a real world system in model form.
Static System Models
- They represent one pair of relationships such as activity–time or cost–quantity.
- The Gantt chart, for example, gives a static picture of an activity-time relationship.
Dynamic System Models
- Business organizations are dynamic systems. A dynamic model approximates the type of organization or application that analysts deal with.
- It shows an ongoing, constantly changing status of the system. It consists of −
- Inputs that enter the system
- The processor through which transformation takes place
- The program(s) required for processing
- The output(s) that result from processing.
Categories of Information
There are three categories of information related to managerial levels and the decision managers make.

Strategic Information
- This information is required by topmost management for long range planning policies for next few years. For example, trends in revenues, financial investment, and human resources, and population growth.
- This type of information is achieved with the aid of Decision Support System (DSS).
Managerial Information
- This type of Information is required by middle management for short and intermediate range planning which is in terms of months. For example, sales analysis, cash flow projection, and annual financial statements.
- It is achieved with the aid of Management Information Systems (MIS).
Operational information
- This type of information is required by low management for daily and short term planning to enforce day-to-day operational activities. For example, keeping employee attendance records, overdue purchase orders, and current stocks available.
- It is achieved with the aid of Data Processing Systems (DPS).
System Development Life Cycle
An effective System Development Life Cycle (SDLC) should result in a high quality system that meets customer expectations, reaches completion within time and cost evaluations, and works effectively and efficiently in the current and planned Information Technology infrastructure.
System Development Life Cycle (SDLC) is a conceptual model which includes policies and procedures for developing or altering systems throughout their life cycles.
SDLC is used by analysts to develop an information system. SDLC includes the following activities −
- requirements
- design
- implementation
- testing
- deployment
- operations
- maintenance
Phases of SDLC
Systems Development Life Cycle is a systematic approach which explicitly breaks down the work into phases that are required to implement either new or modified Information System.

Feasibility Study or Planning
- Define the problem and scope of existing system.
- Overview the new system and determine its objectives.
- Confirm project feasibility and produce the project Schedule.
- During this phase, threats, constraints, integration and security of system are also considered.
- A feasibility report for the entire project is created at the end of this phase.
Analysis and Specification
- Gather, analyze, and validate the information.
- Define the requirements and prototypes for new system.
- Evaluate the alternatives and prioritize the requirements.
- Examine the information needs of end-user and enhances the system goal.
- A Software Requirement Specification (SRS) document, which specifies the software, hardware, functional, and network requirements of the system is prepared at the end of this phase.
System Design
- Includes the design of application, network, databases, user interfaces, and system interfaces.
- Transform the SRS document into logical structure, which contains detailed and complete set of specifications that can be implemented in a programming language.
- Create a contingency, training, maintenance, and operation plan.
- Review the proposed design. Ensure that the final design must meet the requirements stated in SRS document.
- Finally, prepare a design document which will be used during next phases.
Implementation
- Implement the design into source code through coding.
- Combine all the modules together into training environment that detects errors and defects.
- A test report which contains errors is prepared through test plan that includes test related tasks such as test case generation, testing criteria, and resource allocation for testing.
- Integrate the information system into its environment and install the new system.
Maintenance/Support
- Include all the activities such as phone support or physical on-site support for users that is required once the system is installing.
- Implement the changes that software might undergo over a period of time, or implement any new requirements after the software is deployed at the customer location.
- It also includes handling the residual errors and resolve any issues that may exist in the system even after the testing phase.
- Maintenance and support may be needed for a longer time for large systems and for a short time for smaller systems.
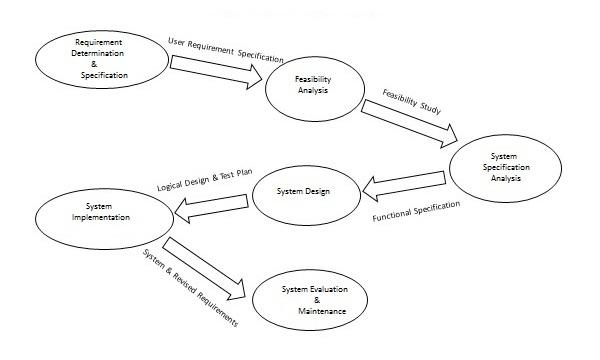
Life Cycle of System Analysis and Design
The following diagram shows the complete life cycle of the system during analysis and design phase.
Role of System Analyst
The system analyst is a person who is thoroughly aware of the system and guides the system development project by giving proper directions. He is an expert having technical and interpersonal skills to carry out development tasks required at each phase.
He pursues to match the objectives of information system with the organization goal.
Main Roles
- Defining and understanding the requirement of user through various Fact finding techniques.
- Prioritizing the requirements by obtaining user consensus.
- Gathering the facts or information and acquires the opinions of users.
- Maintains analysis and evaluation to arrive at appropriate system which is more user friendly.
- Suggests many flexible alternative solutions, pick the best solution, and quantify cost and benefits.
- Draw certain specifications which are easily understood by users and programmer in precise and detailed form.
- Implemented the logical design of system which must be modular.
- Plan the periodicity for evaluation after it has been used for some time, and modify the system as needed.
Attributes of a Systems Analyst
The following figure shows the attributes a systems analyst should possess −
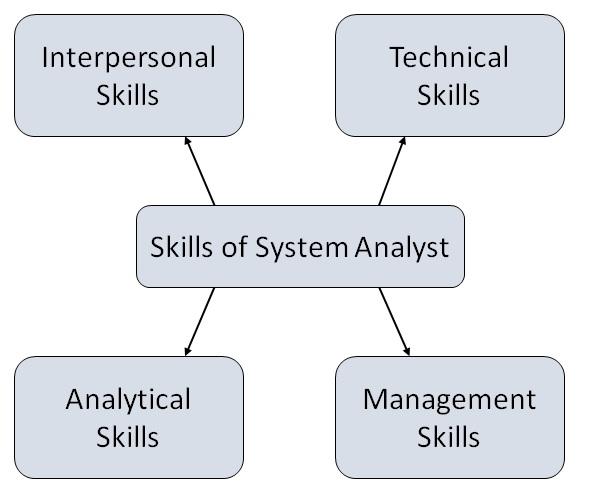
Interpersonal Skills
- Interface with users and programmer.
- Facilitate groups and lead smaller teams.
- Managing expectations.
- Good understanding, communication, selling and teaching abilities.
- Motivator having the confidence to solve queries.
Analytical Skills
- System study and organizational knowledge
- Problem identification, problem analysis, and problem solving
- Sound commonsense
- Ability to access trade-off
- Curiosity to learn about new organization
Management Skills
- Understand users jargon and practices.
- Resource & project management.
- Change & risk management.
- Understand the management functions thoroughly.
Technical Skills
- Knowledge of computers and software.
- Keep abreast of modern development.
- Know of system design tools.
- Breadth knowledge about new technologies.
System Analysis & Design - System Planning
What is Requirements Determination?
A requirement is a vital feature of a new system which may include processing or capturing of data, controlling the activities of business, producing information and supporting the management.
Requirements determination involves studying the existing system and gathering details to find out what are the requirements, how it works, and where improvements should be made.
Major Activities in requirement Determination
Requirements Anticipation
- It predicts the characteristics of system based on previous experience which include certain problems or features and requirements for a new system.
- It can lead to analysis of areas that would otherwise go unnoticed by inexperienced analyst. But if shortcuts are taken and bias is introduced in conducting the investigation, then requirement Anticipation can be half-baked.
Requirements Investigation
- It is studying the current system and documenting its features for further analysis.
- It is at the heart of system analysis where analyst documenting and describing system features using fact-finding techniques, prototyping, and computer assisted tools.
Requirements Specifications
- It includes the analysis of data which determine the requirement specification, description of features for new system, and specifying what information requirements will be provided.
- It includes analysis of factual data, identification of essential requirements, and selection of Requirement-fulfillment strategies.
Information Gathering Techniques
The main aim of fact finding techniques is to determine the information requirements of an organization used by analysts to prepare a precise SRS understood by user.
Ideal SRS Document should −
- be complete, Unambiguous, and Jargon-free.
- specify operational, tactical, and strategic information requirements.
- solve possible disputes between users and analyst.
- use graphical aids which simplify understanding and design.
There are various information gathering techniques −
Interviewing
Systems analyst collects information from individuals or groups by interviewing. The analyst can be formal, legalistic, play politics, or be informal; as the success of an interview depends on the skill of analyst as interviewer.
It can be done in two ways −
- Unstructured Interview − The system analyst conducts question-answer session to acquire basic information of the system.
- Structured Interview − It has standard questions which user need to respond in either close (objective) or open (descriptive) format.
Advantages of Interviewing
- This method is frequently the best source of gathering qualitative information.
- It is useful for them, who do not communicate effectively in writing or who may not have the time to complete questionnaire.
- Information can easily be validated and cross checked immediately.
- It can handle the complex subjects.
- It is easy to discover key problem by seeking opinions.
- It bridges the gaps in the areas of misunderstandings and minimizes future problems.
Questionnaires
This method is used by analyst to gather information about various issues of system from large number of persons.
There are two types of questionnaires −
- Open-ended Questionnaires − It consists of questions that can be easily and correctly interpreted. They can explore a problem and lead to a specific direction of answer.
- Closed-ended Questionnaires − It consists of questions that are used when the systems analyst effectively lists all possible responses, which are mutually exclusive.
Advantages of questionnaires
- It is very effective in surveying interests, attitudes, feelings, and beliefs of users which are not co-located.
- It is useful in situation to know what proportion of a given group approves or disapproves of a particular feature of the proposed system.
- It is useful to determine the overall opinion before giving any specific direction to the system project.
- It is more reliable and provides high confidentiality of honest responses.
- It is appropriate for electing factual information and for statistical data collection which can be emailed and sent by post.
Review of Records, Procedures, and Forms
Review of existing records, procedures, and forms helps to seek insight into a system which describes the current system capabilities, its operations, or activities.
Advantages
- It helps user to gain some knowledge about the organization or operations by themselves before they impose upon others.
- It helps in documenting current operations within short span of time as the procedure manuals and forms describe the format and functions of present system.
- It can provide a clear understanding about the transactions that are handled in the organization, identifying input for processing, and evaluating performance.
- It can help an analyst to understand the system in terms of the operations that must be supported.
- It describes the problem, its affected parts, and the proposed solution.
Observation
This is a method of gathering information by noticing and observing the people, events, and objects. The analyst visits the organization to observe the working of current system and understands the requirements of the system.
Advantages
- It is a direct method for gleaning information.
- It is useful in situation where authenticity of data collected is in question or when complexity of certain aspects of system prevents clear explanation by end-users.
- It produces more accurate and reliable data.
- It produces all the aspect of documentation that are incomplete and outdated.
Joint Application Development (JAD)
It is a new technique developed by IBM which brings owners, users, analysts, designers, and builders to define and design the system using organized and intensive workshops. JAD trained analyst act as facilitator for workshop who has some specialized skills.
Advantages of JAD
- It saves time and cost by replacing months of traditional interviews and follow-up meetings.
- It is useful in organizational culture which supports joint problem solving.
- Fosters formal relationships among multiple levels of employees.
- It can lead to development of design creatively.
- It Allows rapid development and improves ownership of information system.
Secondary Research or Background Reading
This method is widely used for information gathering by accessing the gleaned information. It includes any previously gathered information used by the marketer from any internal or external source.
Advantages
- It is more openly accessed with the availability of internet.
- It provides valuable information with low cost and time.
- It act as forerunner to primary research and aligns the focus of primary research.
- It is used by the researcher to conclude if the research is worth it as it is available with procedures used and issues in collecting them.
Feasibility Study
Feasibility Study can be considered as preliminary investigation that helps the management to take decision about whether study of system should be feasible for development or not.
- It identifies the possibility of improving an existing system, developing a new system, and produce refined estimates for further development of system.
- It is used to obtain the outline of the problem and decide whether feasible or appropriate solution exists or not.
- The main objective of a feasibility study is to acquire problem scope instead of solving the problem.
- The output of a feasibility study is a formal system proposal act as decision document which includes the complete nature and scope of the proposed system.
Steps Involved in Feasibility Analysis
The following steps are to be followed while performing feasibility analysis −
- Form a project team and appoint a project leader.
- Develop system flowcharts.
- Identify the deficiencies of current system and set goals.
- Enumerate the alternative solution or potential candidate system to meet goals.
- Determine the feasibility of each alternative such as technical feasibility, operational feasibility, etc.
- Weight the performance and cost effectiveness of each candidate system.
- Rank the other alternatives and select the best candidate system.
- Prepare a system proposal of final project directive to management for approval.
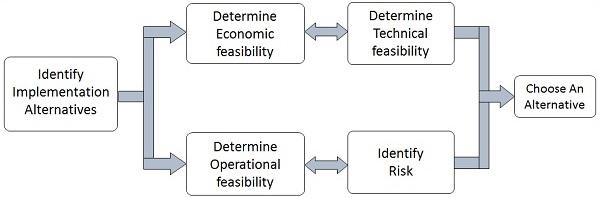
Types of Feasibilities
Economic Feasibility
- It is evaluating the effectiveness of candidate system by using cost/benefit analysis method.
- It demonstrates the net benefit from the candidate system in terms of benefits and costs to the organization.
- The main aim of Economic Feasibility Analysis (EFS) is to estimate the economic requirements of candidate system before investments funds are committed to proposal.
- It prefers the alternative which will maximize the net worth of organization by earliest and highest return of funds along with lowest level of risk involved in developing the candidate system.
Technical Feasibility
- It investigates the technical feasibility of each implementation alternative.
- It analyzes and determines whether the solution can be supported by existing technology or not.
- The analyst determines whether current technical resources be upgraded or added it that fulfill the new requirements.
- It ensures that the candidate system provides appropriate responses to what extent it can support the technical enhancement.
Operational Feasibility
- It determines whether the system is operating effectively once it is developed and implemented.
- It ensures that the management should support the proposed system and its working feasible in the current organizational environment.
- It analyzes whether the users will be affected and they accept the modified or new business methods that affect the possible system benefits.
- It also ensures that the computer resources and network architecture of candidate system are workable.
Behavioral Feasibility
- It evaluates and estimates the user attitude or behavior towards the development of new system.
- It helps in determining if the system requires special effort to educate, retrain, transfer, and changes in employee’s job status on new ways of conducting business.
Schedule Feasibility
- It ensures that the project should be completed within given time constraint or schedule.
- It also verifies and validates whether the deadlines of project are reasonable or not.
Structured Analysis
Analysts use various tools to understand and describe the information system. One of the ways is using structured analysis.
What is Structured Analysis?
Structured Analysis is a development method that allows the analyst to understand the system and its activities in a logical way.
It is a systematic approach, which uses graphical tools that analyze and refine the objectives of an existing system and develop a new system specification which can be easily understandable by user.
It has following attributes −
- It is graphic which specifies the presentation of application.
- It divides the processes so that it gives a clear picture of system flow.
- It is logical rather than physical i.e., the elements of system do not depend on vendor or hardware.
- It is an approach that works from high-level overviews to lower-level details.
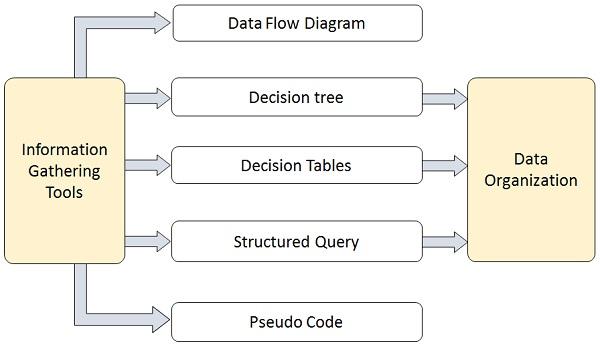
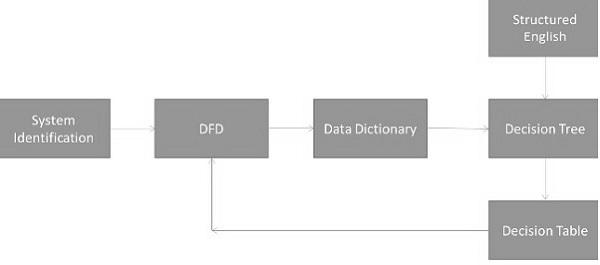
Structured Analysis Tools
During Structured Analysis, various tools and techniques are used for system development. They are −
- Data Flow Diagrams
- Data Dictionary
- Decision Trees
- Decision Tables
- Structured English
- Pseudocode
Data Flow Diagrams (DFD) or Bubble Chart
It is a technique developed by Larry Constantine to express the requirements of system in a graphical form.
- It shows the flow of data between various functions of system and specifies how the current system is implemented.
- It is an initial stage of design phase that functionally divides the requirement specifications down to the lowest level of detail.
- Its graphical nature makes it a good communication tool between user and analyst or analyst and system designer.
- It gives an overview of what data a system processes, what transformations are performed, what data are stored, what results are produced and where they flow.
Basic Elements of DFD
DFD is easy to understand and quite effective when the required design is not clear and the user wants a notational language for communication. However, it requires a large number of iterations for obtaining the most accurate and complete solution.
The following table shows the symbols used in designing a DFD and their significance −
Symbol Name
|
Symbol
|
Meaning
|
Square
|
Source or Destination of Data
| |
Arrow
|
Data flow
| |
Circle
|
Process transforming data flow
| |
Open Rectangle
|
Data Store
|
Types of DFD
DFDs are of two types: Physical DFD and Logical DFD. The following table lists the points that differentiate a physical DFD from a logical DFD.
Physical DFD
|
Logical DFD
|
It is implementation dependent. It shows which functions are performed.
|
It is implementation independent. It focuses only on the flow of data between processes.
|
It provides low level details of hardware, software, files, and people.
|
It explains events of systems and data required by each event.
|
It depicts how the current system operates and how a system will be implemented.
|
It shows how business operates; not how the system can be implemented.
|
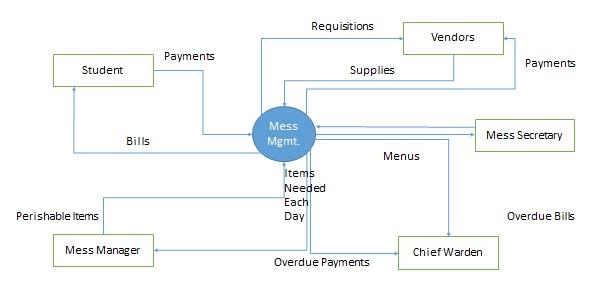
Context Diagram
A context diagram helps in understanding the entire system by one DFD which gives the overview of a system. It starts with mentioning major processes with little details and then goes onto giving more details of the processes with the top-down approach.
The context diagram of mess management is shown below.
Data Dictionary
A data dictionary is a structured repository of data elements in the system. It stores the descriptions of all DFD data elements that is, details and definitions of data flows, data stores, data stored in data stores, and the processes.
A data dictionary improves the communication between the analyst and the user. It plays an important role in building a database. Most DBMSs have a data dictionary as a standard feature. For example, refer the following table −
Sr.No.
|
Data Name
|
Description
|
No. of Characters
|
1
|
ISBN
|
ISBN Number
|
10
|
2
|
TITLE
|
title
|
60
|
3
|
SUB
|
Book Subjects
|
80
|
4
|
ANAME
|
Author Name
|
15
|
Decision Trees
Decision trees are a method for defining complex relationships by describing decisions and avoiding the problems in communication. A decision tree is a diagram that shows alternative actions and conditions within horizontal tree framework. Thus, it depicts which conditions to consider first, second, and so on.
Decision trees depict the relationship of each condition and their permissible actions. A square node indicates an action and a circle indicates a condition. It forces analysts to consider the sequence of decisions and identifies the actual decision that must be made.
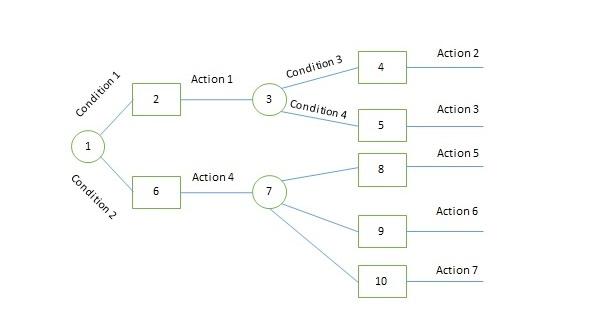
The major limitation of a decision tree is that it lacks information in its format to describe what other combinations of conditions you can take for testing. It is a single representation of the relationships between conditions and actions.
For example, refer the following decision tree −
Decision Tables
Decision tables are a method of describing the complex logical relationship in a precise manner which is easily understandable.
- It is useful in situations where the resulting actions depend on the occurrence of one or several combinations of independent conditions.
- It is a matrix containing row or columns for defining a problem and the actions.
Components of a Decision Table
- Condition Stub − It is in the upper left quadrant which lists all the condition to be checked.
- Action Stub − It is in the lower left quadrant which outlines all the action to be carried out to meet such condition.
- Condition Entry − It is in upper right quadrant which provides answers to questions asked in condition stub quadrant.
- Action Entry − It is in lower right quadrant which indicates the appropriate action resulting from the answers to the conditions in the condition entry quadrant.
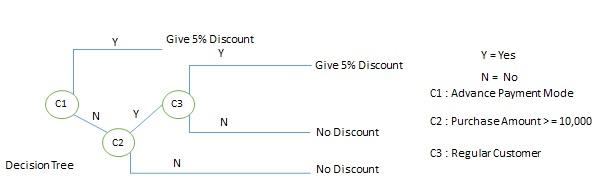
The entries in decision table are given by Decision Rules which define the relationships between combinations of conditions and courses of action. In rules section,
- Y shows the existence of a condition.
- N represents the condition, which is not satisfied.
- A blank - against action states it is to be ignored.
- X (or a check mark will do) against action states it is to be carried out.
For example, refer the following table −
CONDITIONS
|
Rule 1
|
Rule 2
|
Rule 3
|
Rule 4
|
Advance payment made
|
Y
|
N
|
N
|
N
|
Purchase amount = Rs 10,000/-
|
-
|
Y
|
Y
|
N
|
Regular Customer
|
-
|
Y
|
N
|
-
|
ACTIONS
| ||||
Give 5% discount
|
X
|
X
|
-
|
-
|
Give no discount
|
-
|
-
|
X
|
X
|
Structured English
Structure English is derived from structured programming language which gives more understandable and precise description of process. It is based on procedural logic that uses construction and imperative sentences designed to perform operation for action.
- It is best used when sequences and loops in a program must be considered and the problem needs sequences of actions with decisions.
- It does not have strict syntax rule. It expresses all logic in terms of sequential decision structures and iterations.
For example, see the following sequence of actions −
if customer pays advance
then
Give 5% Discount
else
if purchase amount >=10,000
then
if the customer is a regular customer
then Give 5% Discount
else No Discount
end if
else No Discount
end if
end if
Pseudocode
A pseudocode does not conform to any programming language and expresses logic in plain English.
- It may specify the physical programming logic without actual coding during and after the physical design.
- It is used in conjunction with structured programming.
- It replaces the flowcharts of a program.
Guidelines for Selecting Appropriate Tools
Use the following guidelines for selecting the most appropriate tool that would suit your requirements −
- Use DFD at high or low level analysis for providing good system documentations.
- Use data dictionary to simplify the structure for meeting the data requirement of the system.
- Use structured English if there are many loops and actions are complex.
- Use decision tables when there are a large number of conditions to check and logic is complex.
- Use decision trees when sequencing of conditions is important and if there are few conditions to be tested.
System Analysis & Design - System Design
System design is the phase that bridges the gap between problem domain and the existing system in a manageable way. This phase focuses on the solution domain, i.e. “how to implement?”
It is the phase where the SRS document is converted into a format that can be implemented and decides how the system will operate.
In this phase, the complex activity of system development is divided into several smaller sub-activities, which coordinate with each other to achieve the main objective of system development.
Inputs to System Design
System design takes the following inputs −
- Statement of work
- Requirement determination plan
- Current situation analysis
- Proposed system requirements including a conceptual data model, modified DFDs, and Metadata (data about data).
Outputs for System Design
System design gives the following outputs −
- Infrastructure and organizational changes for the proposed system.
- A data schema, often a relational schema.
- Metadata to define the tables/files and columns/data-items.
- A function hierarchy diagram or web page map that graphically describes the program structure.
- Actual or pseudocode for each module in the program.
- A prototype for the proposed system.
Types of System Design
Logical Design
Logical design pertains to an abstract representation of the data flow, inputs, and outputs of the system. It describes the inputs (sources), outputs (destinations), databases (data stores), procedures (data flows) all in a format that meets the user requirements.
While preparing the logical design of a system, the system analyst specifies the user needs at level of detail that virtually determines the information flow into and out of the system and the required data sources. Data flow diagram, E-R diagram modeling are used.
Physical Design
Physical design relates to the actual input and output processes of the system. It focuses on how data is entered into a system, verified, processed, and displayed as output.
It produces the working system by defining the design specification that specifies exactly what the candidate system does. It is concerned with user interface design, process design, and data design.
It consists of the following steps −
- Specifying the input/output media, designing the database, and specifying backup procedures.
- Planning system implementation.
- Devising a test and implementation plan, and specifying any new hardware and software.
- Updating costs, benefits, conversion dates, and system constraints.
Architectural Design
It is also known as high level design that focuses on the design of system architecture. It describes the structure and behavior of the system. It defines the structure and relationship between various modules of system development process.
Detailed Design
It follows Architectural design and focuses on development of each module.
Conceptual Data Modeling
It is representation of organizational data which includes all the major entities and relationship. System analysts develop a conceptual data model for the current system that supports the scope and requirement for the proposed system.
The main aim of conceptual data modeling is to capture as much meaning of data as possible. Most organization today use conceptual data modeling using E-R model which uses special notation to represent as much meaning about data as possible.
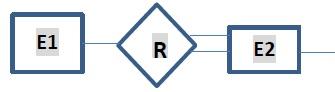
Entity Relationship Model
It is a technique used in database design that helps describe the relationship between various entities of an organization.
Terms used in E-R model
- ENTITY − It specifies distinct real world items in an application. For example: vendor, item, student, course, teachers, etc.
- RELATIONSHIP − They are the meaningful dependencies between entities. For example, vendor supplies items, teacher teaches courses, then supplies and course are relationship.
- ATTRIBUTES − It specifies the properties of relationships. For example, vendor code, student name. Symbols used in E-R model and their respective meanings −
The following table shows the symbols used in E-R model and their significance −
Symbol
|
Meaning
|
Entity
| |
 |
Weak Entity
|
 |
Relationship
|
 |
Identity Relationship
|
 |
Attributes
|
 |
Key Attributes
|
 |
Multivalued
|
 |
Composite Attribute
|
 |
Derived Attributes
|
 |
Total Participation of E2 in R
|
 |
Cardinality Ratio 1:N for E1:E2 in R
|
Three types of relationships can exist between two sets of data: one-to-one, one-to-many, and many-to-many.
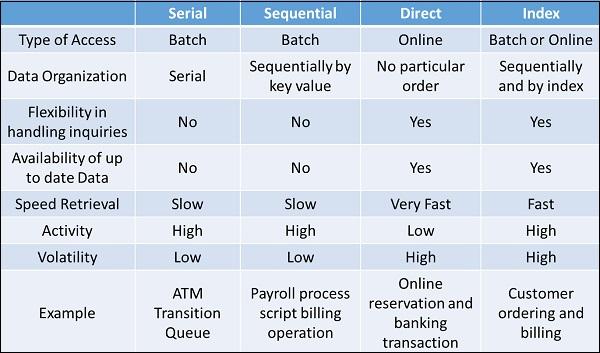
File Organization
It describes how records are stored within a file.
There are four file organization methods −
- Serial − Records are stored in chronological order (in order as they are input or occur). Examples − Recording of telephone charges, ATM transactions, Telephone queues.
- Sequential − Records are stored in order based on a key field which contains a value that uniquely identifies a record. Examples − Phone directories.
- Direct (relative) − Each record is stored based on a physical address or location on the device. Address is calculated from the value stored in the record’s key field. Randomizing routine or hashing algorithm does the conversion.
- Indexed − Records can be processed both sequentially and non-sequentially using indexes.
Comparision
File Access
One can access a file using either Sequential Access or Random Access. File Access methods allow computer programs read or write records in a file.
Sequential Access
Every record on the file is processed starting with the first record until End of File (EOF) is reached. It is efficient when a large number of the records on the file need to be accessed at any given time. Data stored on a tape (sequential access) can be accessed only sequentially.
Direct (Random) Access
Records are located by knowing their physical locations or addresses on the device rather than their positions relative to other records. Data stored on a CD device (direct-access) can be accessed either sequentially or randomly.
Types of Files used in an Organization System
Following are the types of files used in an organization system −
- Master file − It contains the current information for a system. For example, customer file, student file, telephone directory.
- Table file − It is a type of master file that changes infrequently and stored in a tabular format. For example, storing Zipcode.
- Transaction file − It contains the day-to-day information generated from business activities. It is used to update or process the master file. For example, Addresses of the employees.
- Temporary file − It is created and used whenever needed by a system.
- Mirror file − They are the exact duplicates of other files. Help minimize the risk of downtime in cases when the original becomes unusable. They must be modified each time the original file is changed.
- Log files − They contain copies of master and transaction records in order to chronicle any changes that are made to the master file. It facilitates auditing and provides mechanism for recovery in case of system failure.
- Archive files − Backup files that contain historical versions of other files.
Documentation Control
Documentation is a process of recording the information for any reference or operational purpose. It helps users, managers, and IT staff, who require it. It is important that prepared document must be updated on regular basis to trace the progress of the system easily.
After the implementation of system if the system is working improperly, then documentation helps the administrator to understand the flow of data in the system to correct the flaws and get the system working.
Programmers or systems analysts usually create program and system documentation. Systems analysts usually are responsible for preparing documentation to help users learn the system. In large companies, a technical support team that includes technical writers might assist in the preparation of user documentation and training materials.
Advantages
- It can reduce system downtime, cut costs, and speed up maintenance tasks.
- It provides the clear description of formal flow of present system and helps to understand the type of input data and how the output can be produced.
- It provides effective and efficient way of communication between technical and nontechnical users about system.
- It facilitates the training of new user so that he can easily understand the flow of system.
- It helps the user to solve the problems such as troubleshooting and helps the manager to take better final decisions of the organization system.
- It provides better control to the internal or external working of the system.
Types of Documentations
When it comes to System Design, there are following four main documentations −
- Program documentation
- System documentation
- Operations documentation
- User documentation
Program Documentation
- It describes inputs, outputs, and processing logic for all the program modules.
- The program documentation process starts in the system analysis phase and continues during implementation.
- This documentation guides programmers, who construct modules that are well supported by internal and external comments and descriptions that can be understood and maintained easily.
Operations Documentation
Operations documentation contains all the information needed for processing and distributing online and printed output. Operations documentation should be clear, concise, and available online if possible.
It includes the following information −
- Program, systems analyst, programmer, and system identification.
- Scheduling information for printed output, such as report, execution frequency, and deadlines.
- Input files, their source, output files, and their destinations.
- E-mail and report distribution lists.
- Special forms required, including online forms.
- Error and informational messages to operators and restart procedures.
- Special instructions, such as security requirements.
User Documentation
It includes instructions and information to the users who will interact with the system. For example, user manuals, help guides, and tutorials. User documentation is valuable in training users and for reference purpose. It must be clear, understandable, and readily accessible to users at all levels.
The users, system owners, analysts, and programmers, all put combined efforts to develop a user’s guide.
A user documentation should include −
- A system overview that clearly describes all major system features, capabilities, and limitations.
- Description of source document content, preparation, processing, and, samples.
- Overview of menu and data entry screen options, contents, and processing instructions.
- Examples of reports that are produced regularly or available at the user’s request, including samples.
- Security and audit trail information.
- Explanation of responsibility for specific input, output, or processing requirements.
- Procedures for requesting changes and reporting problems.
- Examples of exceptions and error situations.
- Frequently asked questions (FAQs).
- Explanation of how to get help and procedures for updating the user manual.
System Documentation
System documentation serves as the technical specifications for the IS and how the objectives of the IS are accomplished. Users, managers and IS owners need never reference system documentation. System documentation provides the basis for understanding the technical aspects of the IS when modifications are made.
- It describes each program within the IS and the entire IS itself.
- It describes the system’s functions, the way they are implemented, each program's purpose within the entire IS with respect to the order of execution, information passed to and from programs, and overall system flow.
- It includes data dictionary entries, data flow diagrams, object models, screen layouts, source documents, and the systems request that initiated the project.
- Most of the system documentation is prepared during the system analysis and system design phases.
- During systems implementation, an analyst must review system documentation to verify that it is complete, accurate, and up-to-date, and including any changes made during the implementation process.
Design Strategies
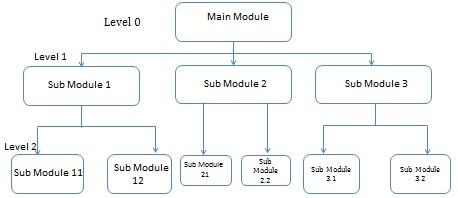
Top-Down Strategy
The top-down strategy uses the modular approach to develop the design of a system. It is called so because it starts from the top or the highest-level module and moves towards the lowest level modules.
In this technique, the highest-level module or main module for developing the software is identified. The main module is divided into several smaller and simpler submodules or segments based on the task performed by each module. Then, each submodule is further subdivided into several submodules of next lower level. This process of dividing each module into several submodules continues until the lowest level modules, which cannot be further subdivided, are not identified.
Bottom-Up Strategy
Bottom-Up Strategy follows the modular approach to develop the design of the system. It is called so because it starts from the bottom or the most basic level modules and moves towards the highest level modules.
In this technique,
- The modules at the most basic or the lowest level are identified.
- These modules are then grouped together based on the function performed by each module to form the next higher-level modules.
- Then, these modules are further combined to form the next higher-level modules.
- This process of grouping several simpler modules to form higher level modules continues until the main module of system development process is achieved.

Structured Design
Structured design is a data-flow based methodology that helps in identifying the input and output of the developing system. The main objective of structured design is to minimize the complexity and increase the modularity of a program. Structured design also helps in describing the functional aspects of the system.
In structured designing, the system specifications act as a basis for graphically representing the flow of data and sequence of processes involved in a software development with the help of DFDs. After developing the DFDs for the software system, the next step is to develop the structure chart.
Modularization
Structured design partitions the program into small and independent modules. These are organized in top down manner with the details shown in bottom.
Thus, structured design uses an approach called Modularization or decomposition to minimize the complexity and to manage the problem by subdividing it into smaller segments.
Advantages
- Critical interfaces are tested first.
- It provide abstraction.
- It allows multiple programmers to work simultaneously.
- It allows code reuse.
- It provides control and improves morale.
- It makes identifying structure easier.
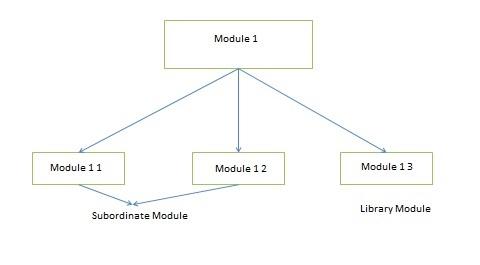
Structured Charts
Structured charts are a recommended tool for designing a modular, top down systems which define the various modules of system development and the relationship between each module. It shows the system module and their relationship between them.
It consists of diagram consisting of rectangular boxes that represent the modules, connecting arrows, or lines.
- Control Module − It is a higher-level module that directs lower-level modules, called subordinate modules.
- Library Module − It is a reusable module and can be invoked from more than one point in the chart.
We have two different approaches to design a structured chart −
- Transform-Centered Structured Charts − They are used when all the transactions follow same path.
- Transaction–Centered Structured Charts − They are used when all the transactions do not follow the same path.
Objectives of Using Structure Flowcharts
- To encourage a top-down design.
- To support the concept of modules and identify the appropriate modules.
- To show the size and complexity of the system.
- To identify the number of readily identifiable functions and modules within each function.
- To depict whether each identifiable function is a manageable entity or should be broken down into smaller components.
Factors Affecting System Complexity
To develop good quality of system software, it is necessary to develop a good design. Therefore, the main focus on while developing the design of the system is the quality of the software design. A good quality software design is the one, which minimizes the complexity and cost expenditure in software development.
The two important concepts related to the system development that help in determining the complexity of a system are coupling and cohesion.
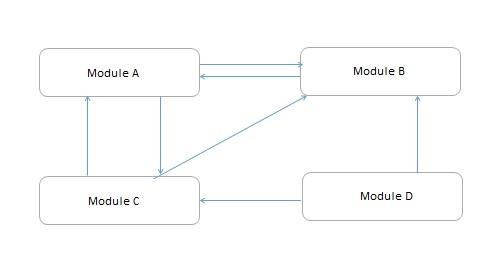
Coupling
Coupling is the measure of the independence of components. It defines the degree of dependency of each module of system development on the other. In practice, this means the stronger the coupling between the modules in a system, the more difficult it is to implement and maintain the system.
Each module should have simple, clean interface with other modules, and that the minimum number of data elements should be shared between modules.
High Coupling
These type of systems have interconnections with program units dependent on each other. Changes to one subsystem leads to high impact on the other subsystem.

Low Coupling
These type of systems are made up of components which are independent or almost independent. A change in one subsystem does not affect any other subsystem.
Coupling Measures
- Content Coupling − When one component actually modifies another,then the modified component is completely dependent on modifying one.
- Common Coupling − When amount of coupling is reduced somewhat by organizing system design so that data are accessible from a common data store.
- Control Coupling − When one component passes parameters to control the activity of another component.
- Stamp Coupling − When data structures is used to pass information from one component to another.
- Data Coupling − When only data is passed then components are connected by this coupling.
Cohesion
Cohesion is the measure of closeness of the relationship between its components. It defines the amount of dependency of the components of a module on one another. In practice, this means the systems designer must ensure that −
- They do not split essential processes into fragmented modules.
- They do not gather together unrelated processes represented as processes on the DFD into meaningless modules.
The best modules are those that are functionally cohesive. The worst modules are those that are coincidentally cohesive.
The worst degree of cohesion
Coincidental cohesion is found in a component whose parts are unrelated to another.
- Logical Cohesion − It is where several logically related functions or data elements are placed in same component.
- Temporal Cohesion − It is when a component that is used to initialize a system or set variables performs several functions in sequence, but the functions are related by timing involved.
- Procedurally Cohesion − It is when functions are grouped together in a component just to ensure this order.
- Sequential Cohesion − It is when the output from one part of a component is the input to the next part of it.